Unfortunately, due to Corona, I can’t compete in the Bohemian Border Bash Race (BBBR) that started this weekend. But this gives me time to share with you my tips for creating a roadbook.
You don’t necessarily need a roadbook, of course, but for races or even longer tours, it’s a good idea to take a closer look at the route beforehand and make notes on important points and sections.
My first “roadbook” was the route and stage overview for the Tuscany Trail, where I could see what was in store for me every day. At the time, however, I saw it only as background information, and less as a useful tool for resupply and daily planning. Then a few years later, my roadbook consisted of a brief overview of possible resupply stops with mileage on an Orbit tour. A small piece of paper I had attached to my cockpit.
When I dived more intensively into the world of endurance Bikepacking Races, it was Tobias who presented a roadbook at the Atlas Mountain Race, which helped us a lot. It was already very detailed, had an elevation profile, an overview of the most important aid stations and information about climbs and trail conditions. Divided into 200km sections, it was an important tool to plan the next kilometers and especially to see when it is appropriate to bunker food or which mountains come when and how they are.
During the Silk Road Mountain Race, we refined the roadbook again and were able to show the degree of the climbs better, especially in the elevation profile.
This was also the template for my roadbook now for the Bohemian Border Bash and in the following I will show you exemplarily how I proceed when creating one.
1. The Track
Of course, the most important thing is the track, which should be available as a GPX file. In the current case I have this available on Komoot. Here I get the route on the map and directly below the tour profile and information about the trail types and conditions.
These two details are an important indicator for me, because here I can see how much asphalt or road surface is approximately and how much of the route is on gravel, forest paths or trails. On this basis, I can already make a good estimate of how I will progress. Off-road, of course, a little slower than on the road, for example. A route with a high percentage of asphalt is therefore at first glance a little faster.
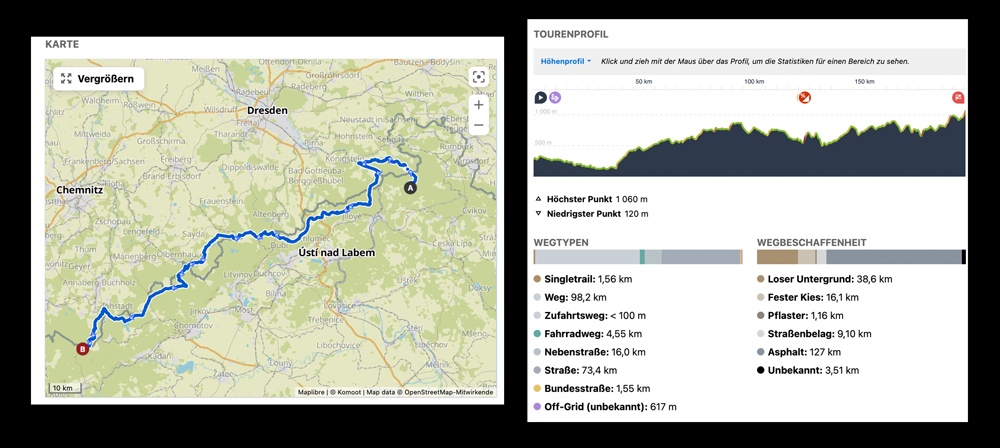
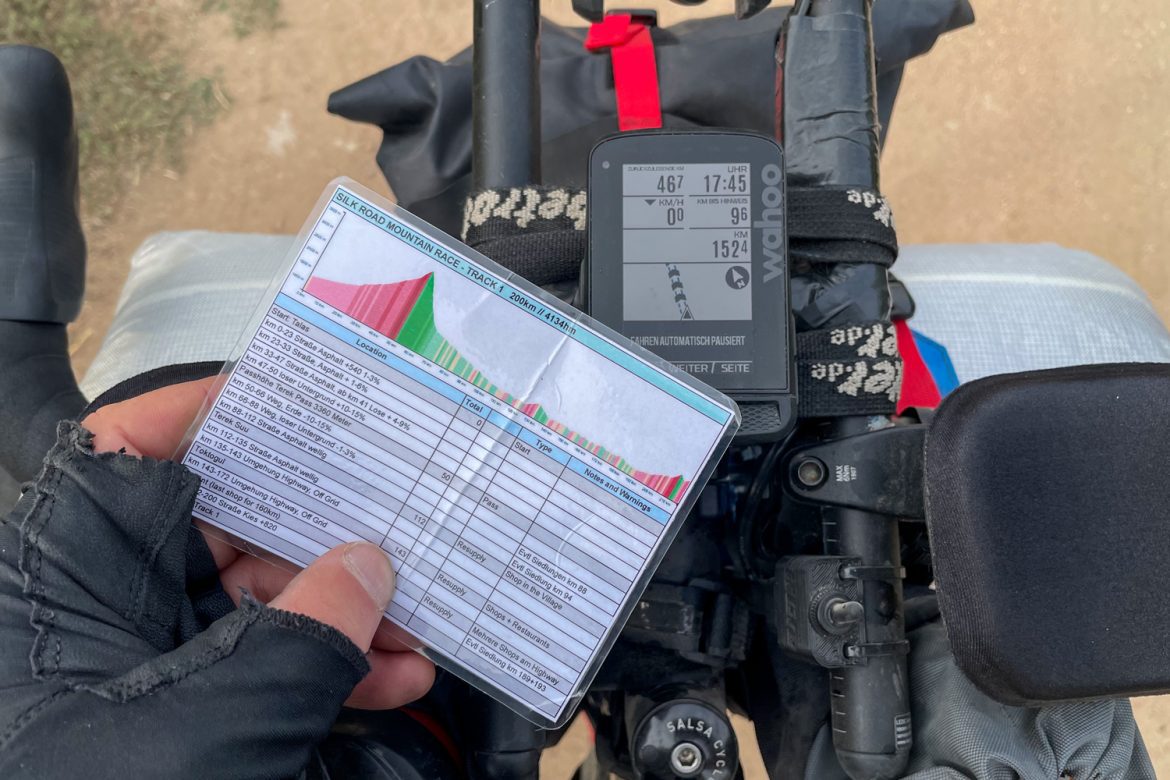
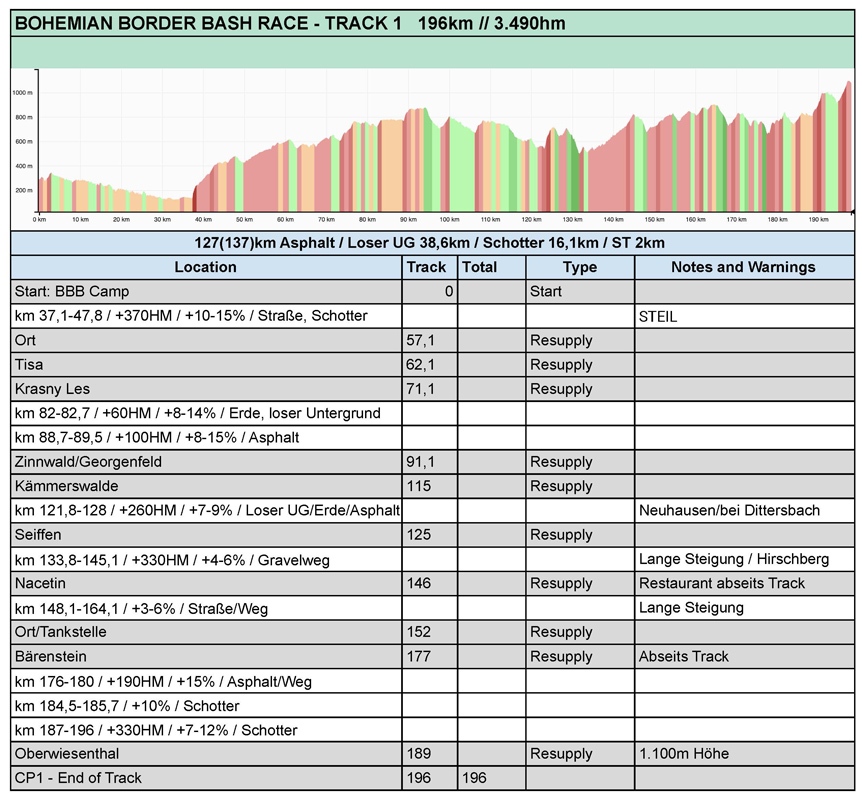
The second indicator is the altitude profile. Here you can see the first 200km of the Bohemian Border Bash Race in the current example with corresponding notes and coloring of the very steep passages. Then I already know: Climbing or even pushing is required.
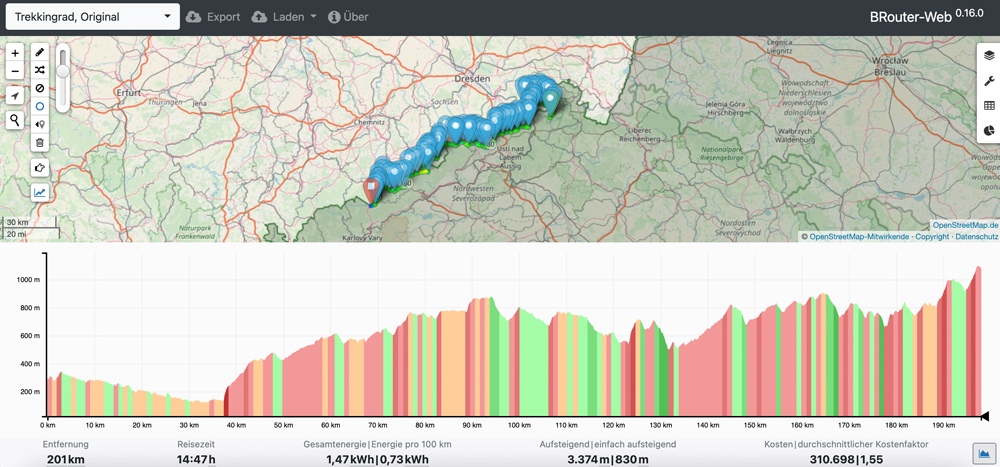
In Komoot I now download the route as a GPX file. Then I open BRouter and upload the GPX as a route. BRouter gives me in addition to the route also the altitude profile, which, however, in contrast to Komoot the slopes and gradients colored. So you get even a better feel for the route and its structure.
In Excel I created a roadbook template (or Tobias did), which I modified slightly. Now I enter the information about the track section in the header and the information about the trail conditions and length.

I copy the elevation profile into the header of my roadbook (via screenshot). This is honestly the most important element for me, because here I can always directly compare where I am, what lies directly in front of me and which gradients and track sections await me in which intensity and when.
2. The Details
Now it’s time for the details, which are quite individual. In my case the roadbook has 5 columns:
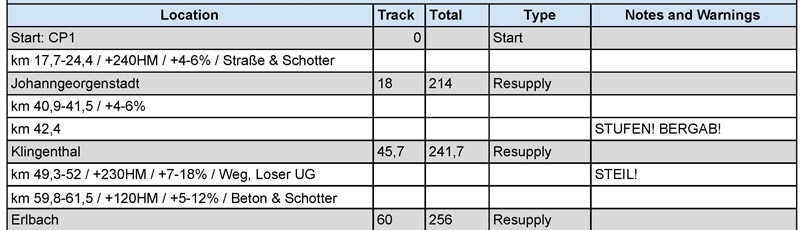
- Location: Here I enter important waypoints, but also route sections. Waypoints are grayed out. Track sections are white.
- Track: Here are the kilometers to the locations of the current track. On my GPS device I can display the remaining and covered kilometers on the current track. And so I know pretty well during the ride, when which location or section comes.
- Total: Here are the total kilometers in it. For multi-day tours, I can see here how many kilometers in total I have already covered at a certain point. If a tour is 750km long, I see in the column Track for example 54km – Location Leipzig. And at Total 543km, since a total of 543km of 750km have been covered at this point.
- Type: This defines the type of location in more detail. For example Resupply for supply possibilities, or CP for checkpoints or whatever you consider important.
- Note and Warnings: Here you can enter important additional information about the corresponding section or location. Like for example notes if special precautions apply (we had in Kyrgyzstan), or if a resupply point is the last one before a very long stretch without, or if sections come that are very demanding.
To gather this information, I go back into Komoot and zoom into the track. First I identify larger towns and supply points, which I then enter in my roadbook with kilometer information. I also compare this with Google Maps to find out, for example, whether there is an infrastructure in a place, such as stores, restaurants or hotels. This is sometimes not exactly visible on Komoot (at least for me).

The next thing I do is pick out distinctive track points. These are for example particularly strong gradients. For this I select the corresponding section in the Komoot elevation profile. Komoot then shows me this selection in more detail and I can “ride” the corresponding track sections with the cursor.
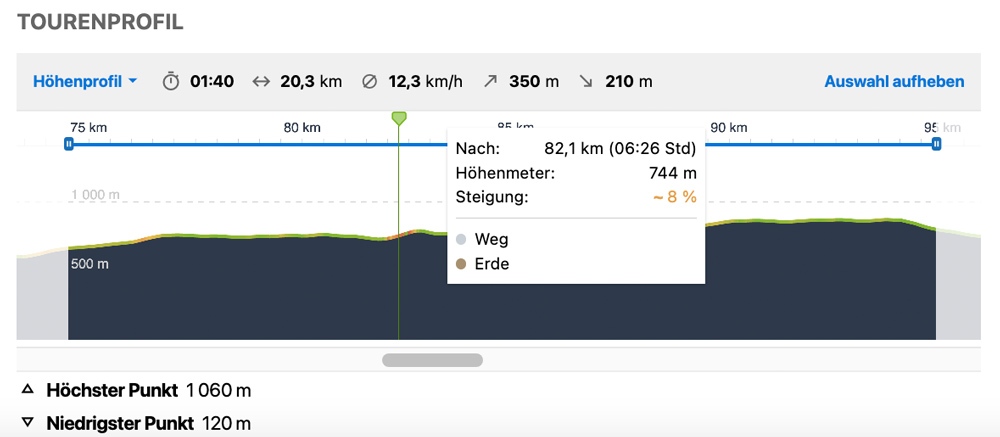
Thereby I get on the one hand information about the gradient percent and on the other hand about the path condition. So I see whether the 8% slope, for example, take place on soil or asphalt. These are already differences, on the basis of which I can estimate well, how well I possibly drive this.
In the roadbook it says for example: km 37,1-47,8 / +370HM / +10-15% / road, gravel
This means: from kilometer 37,1 to kilometer 47,8 there are 370 meters of altitude to be climbed, with gradients of 10 to 15%, mainly on road and then gravel.
I do this for all sections of a track that are important to me and transfer this in parallel to the roadbook. At the end a track section is ready, which contains all the information I need.
In the case of the Bohemian Border Bash Race I created 12 of these tracks as roadbook maps. This takes some time and again I check the data and information. It is important that you stay with one track provider: So either Komoot or BRouter or Ride with GPS, because the tracks are different from provider to provider algorithm-conditioned.
For example, the example track section at Komoot is 196km long and has 3,490 meters of altitude. At BRouter, the same track is 201km long and has 3,374 vertical meters. I chose Komoot in this case, because the organizer has also published the route sections there. In addition, the deviation are rather small.
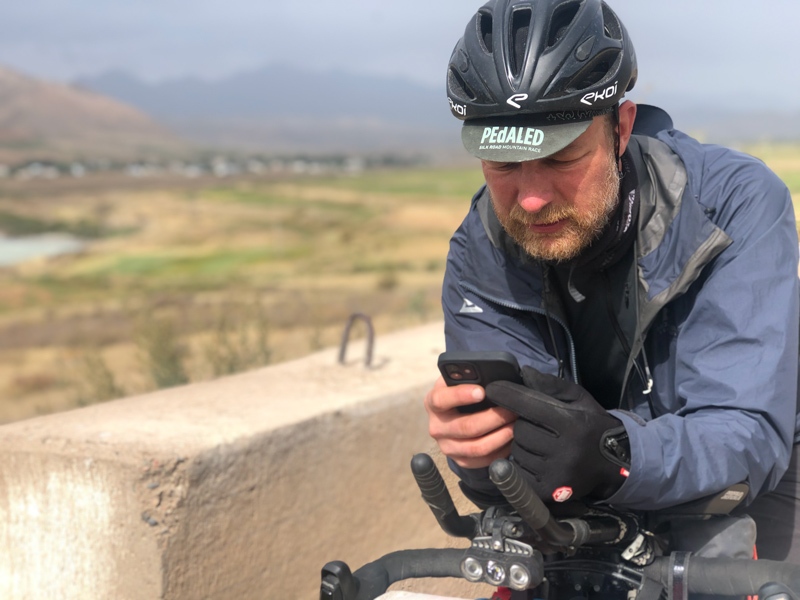
On the road I have the roadbook either as a printout (ideally laminated) with me, or digitally on the smartphone as a PDF or image.
3. Useful Things
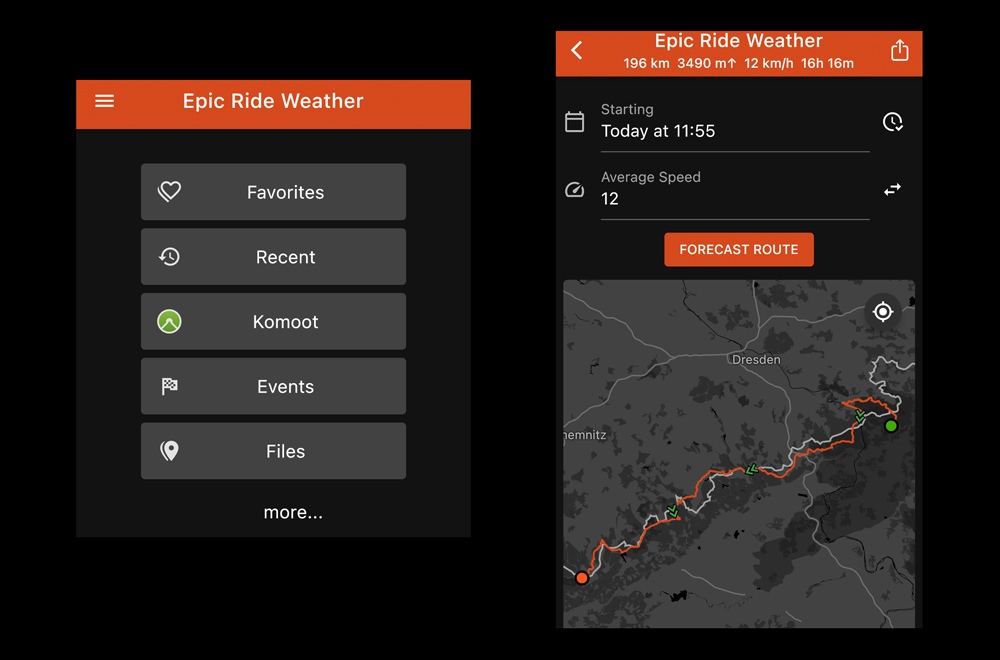
I’d like to recommend two more apps that work well for me on the road and in advance: EpicRideWeather and iOverlander.
EpicRideWeather is – as the name suggests – a weather app for Android and iOS, but it works track-based. For this, you can call up the respective track in the app (for example, via Komoot) and then choose for which date the forecast should apply and at what average speed you ride.
Afterwards the app gives you a quite extensive information overview about rain probability over the whole track in the calculated period, wind directions and speeds, UV index, temperature and more.
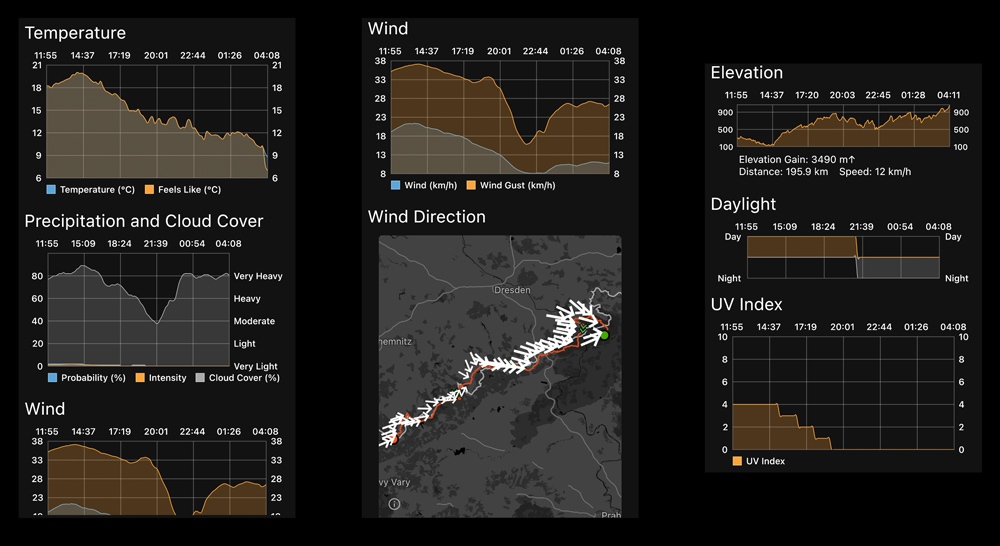
This is pretty good, for example, to better assess the weather on the road during a tour in the mountains. Or to be able to prepare well for a section of a race.
iOverlander is a bit older and I sometimes use this app to look at certain places to see if there are places to stay in nature, where I might find drinking water, or where campsites or other accommodations are.
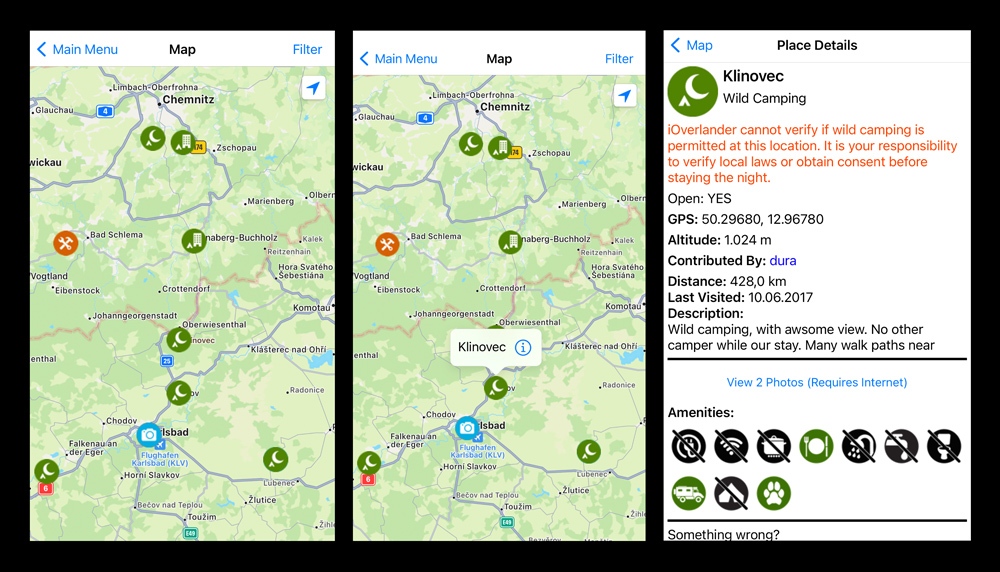
This point of interest overview is community based. This means that you can also contribute to it yourself and, for example, enter good bivouac sites or shelters.
If you have any questions about the roadbook and other tips for useful apps, I look forward to your questions and comments.